Log View Widget
Overview
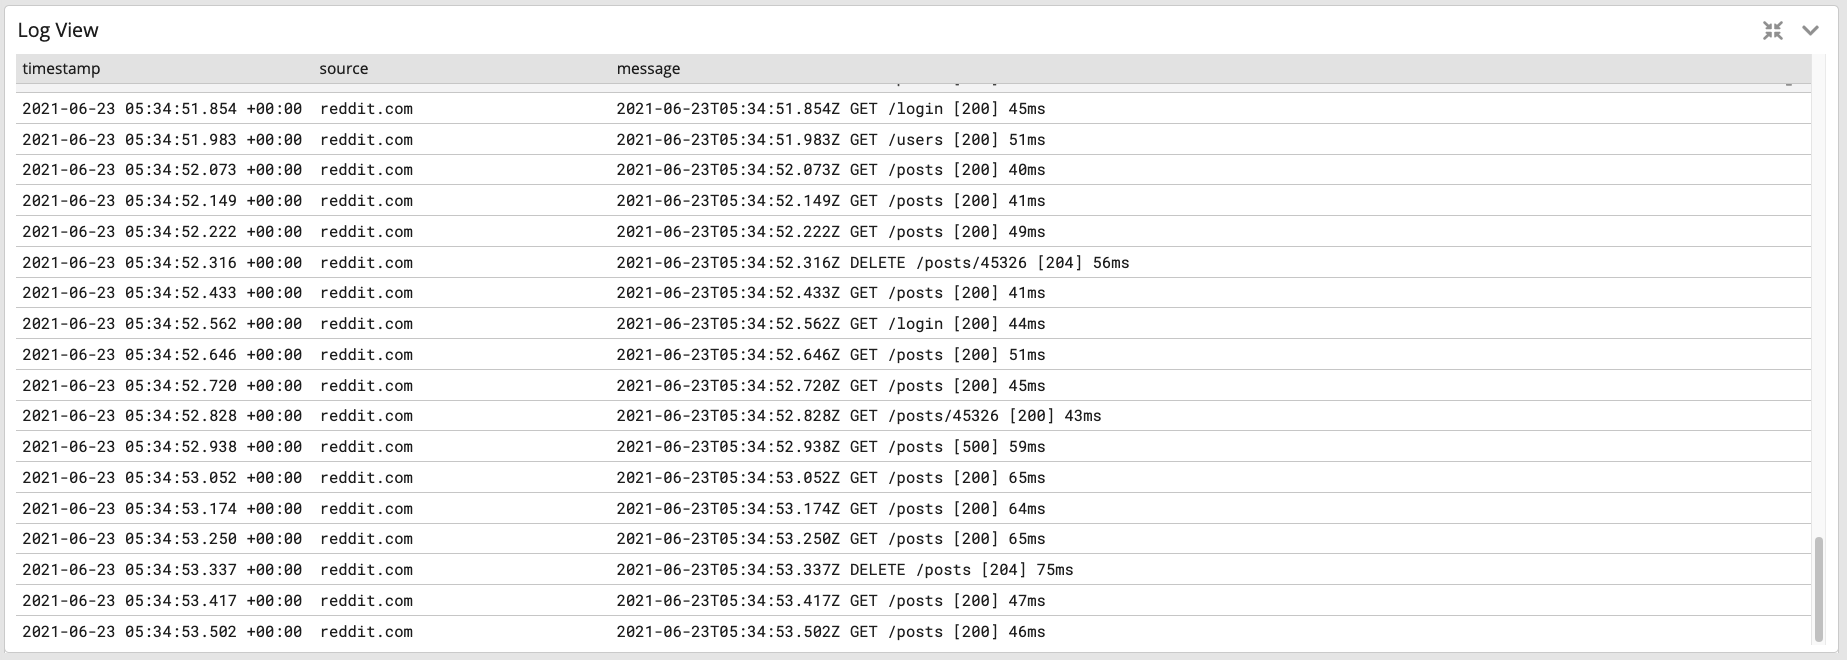
Log View is a widget that presents your log data in a format similar to Common Log Format.In other terms, it has the look and feel of a console output. In addition, the Log View widgetallows you to scroll through log events as it populates new lines in real-time.
Of course, the Log View widget will provide you a way to investigate your log events, toaccomplish such actions as:
- recording faults to diagnose and debug
- identifying security breaches and other system and network misuses.
- auditing
When you build aggregations in the Log View widget expect it to help you create highlycustomizable reports and infographics. Furthermore, you can add them to your dashboards.Also, you can save and retrieve them, in the event you need to review that data again.At any time, you can add new values, fields, and metrics to build reports that you need.
Note
According to the section Export results as CSV, Graylog Open Source is limited to exports in CSV.However, three additional formats are available in Enterprise: JSON, Newline delimited JSON,and Plain Text form.
Log View Usage
To get familiar with Log View, perform the following actions.
- Create a new Log View widget.
- Expand your report with additional fields, in the widget.
- Focus on the widget with an expanded view.
- Export data from your widget.
Create a Log View Widget
The Log View Widget is located on the expandable bar, screen left.
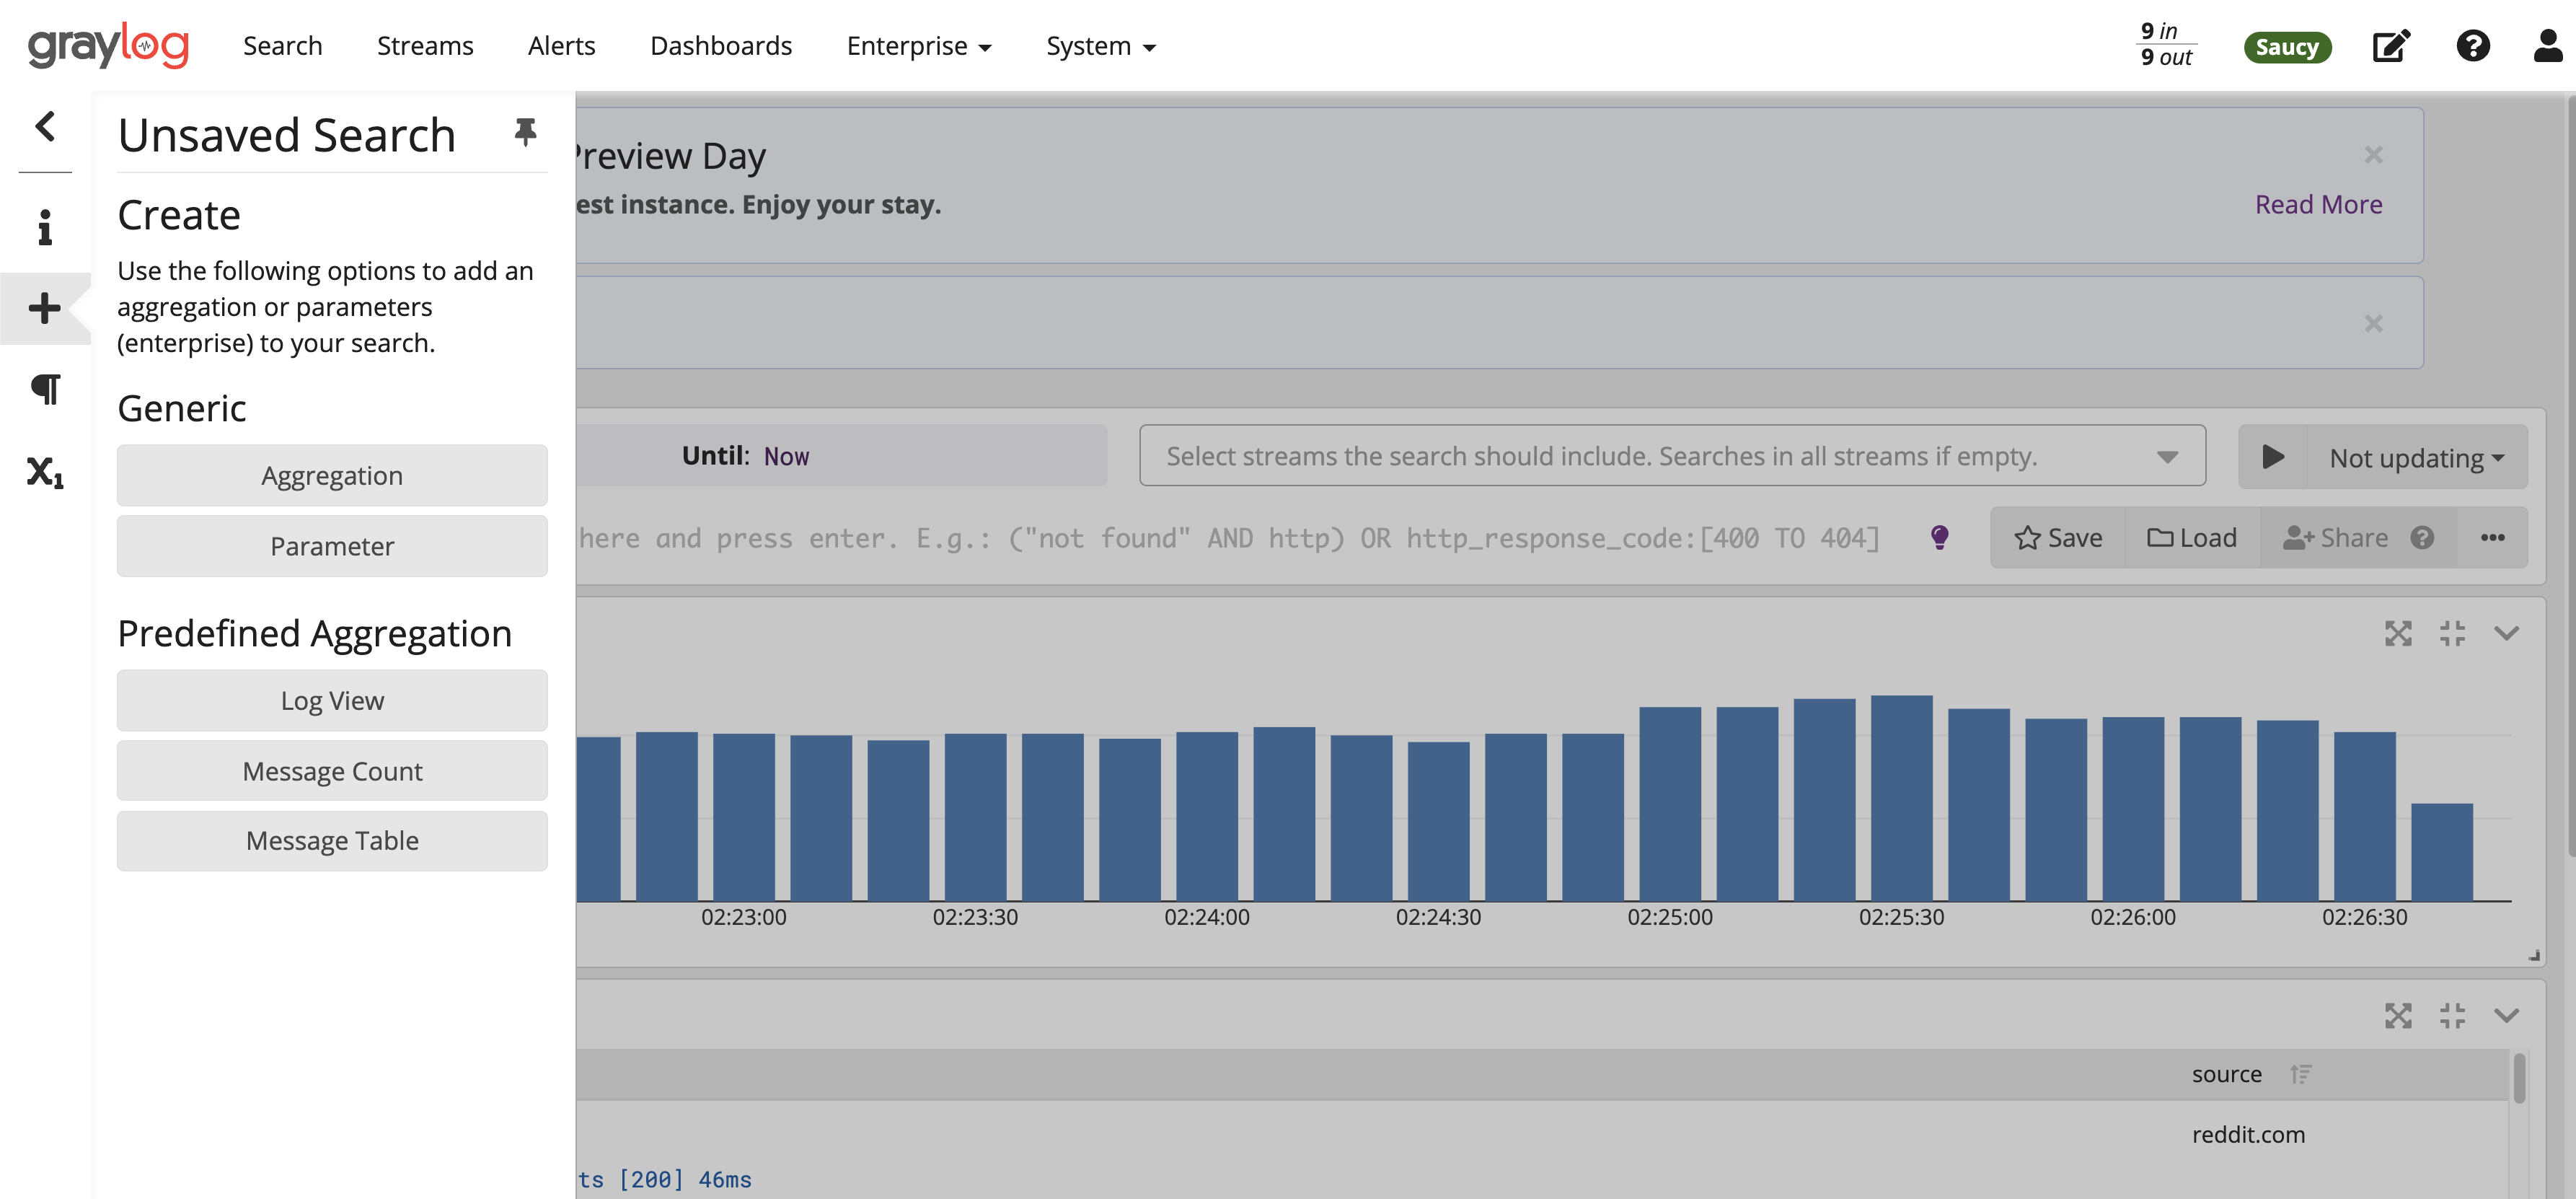
To create your first widget:
- Click the Create (+) button to extend the menu.
- Select Log View to generate the widget in the main UI.
When the button generates a new widget, timestamp,
source, and messageare the defaultfields presented in plain text format.
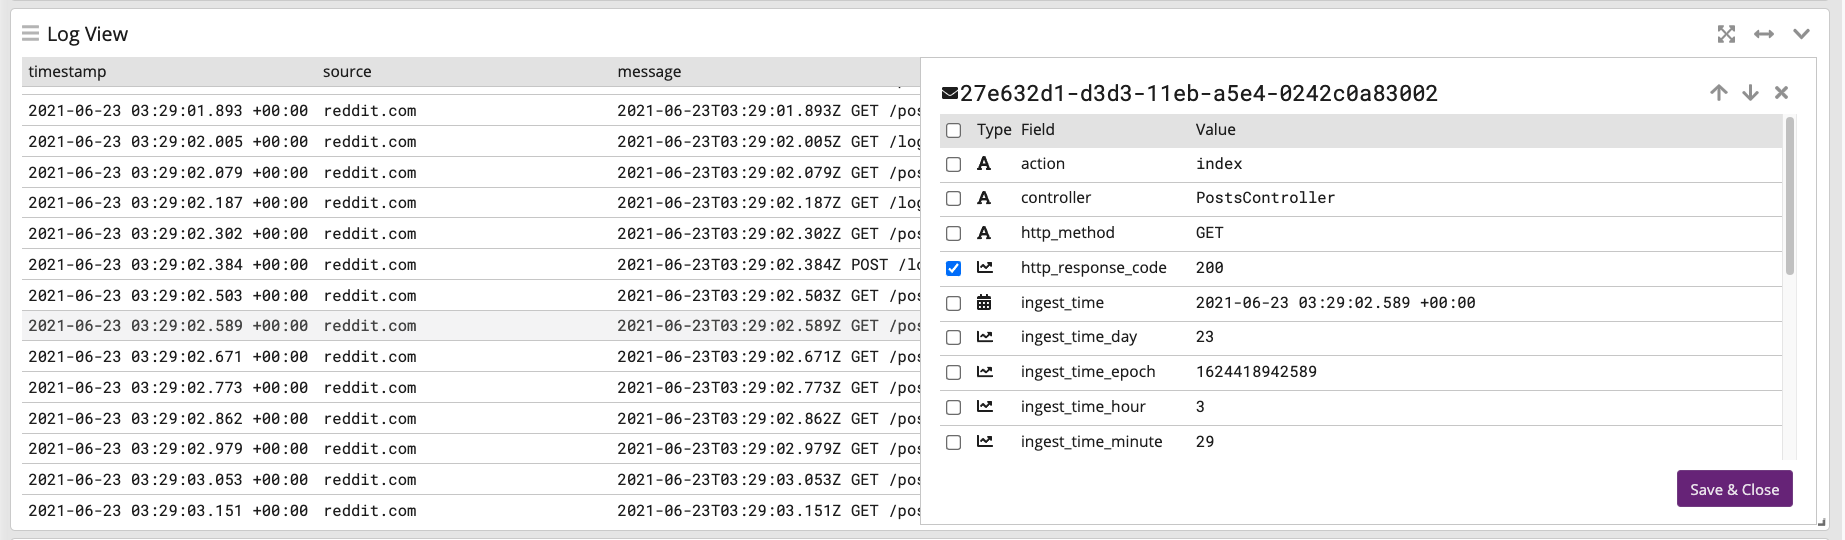
Add New Fields to the Report
To build more informed reports, you might add a new field to the widget. For example, you mayneed to associate activity between company.organd an http response code.
![]()
- Click the diagonal arrow icon on right side of a logline.
- Review and select one or more options, e.g.
http_response_code.
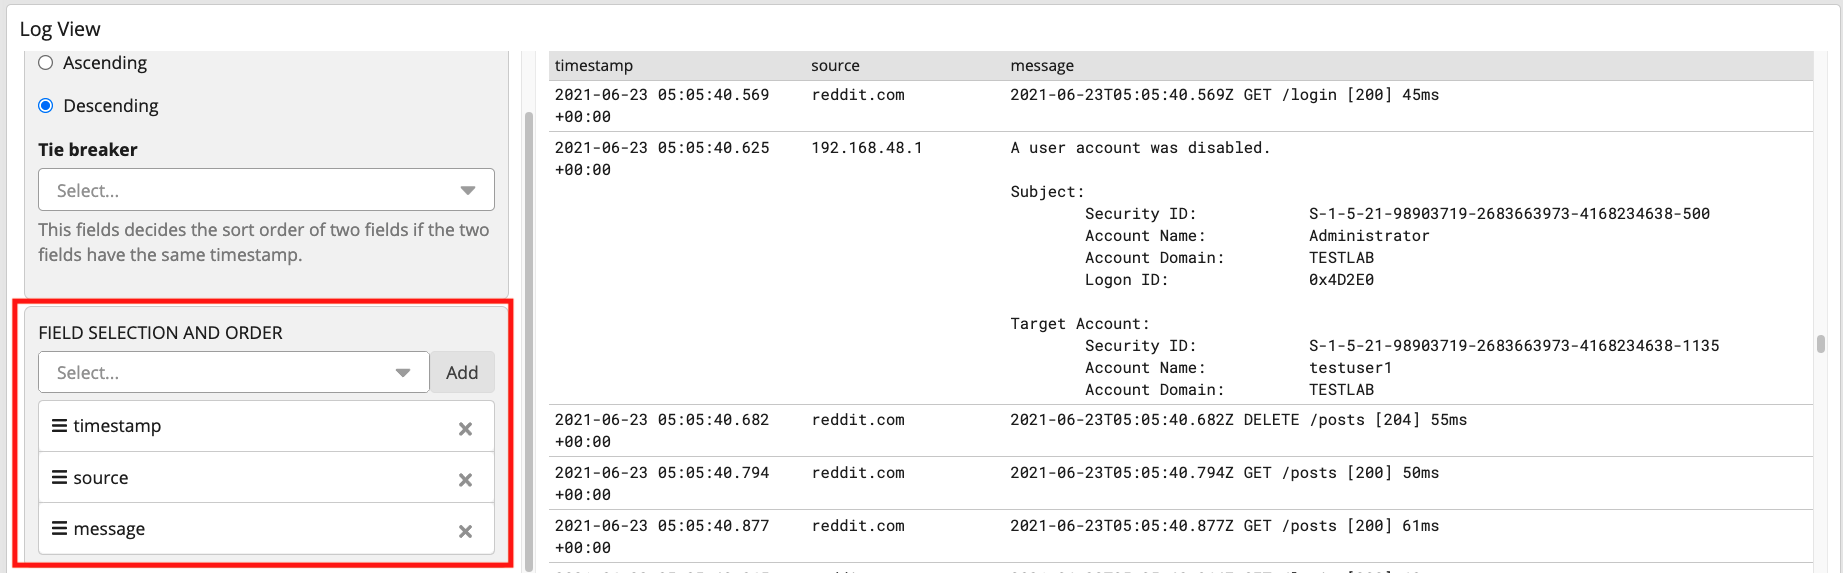
Alternately, you can add new fields via the chevron icon (mentioned in “Aggregation”).
- Click Edit from the menu.
- Locate FIELD SELECTION AND ORDER on the bottom left.
- Click the dropdown arrow, or type in a value.
- Click Add to include the field in your widget.
- Press the Apply Changes button to save all your edits.
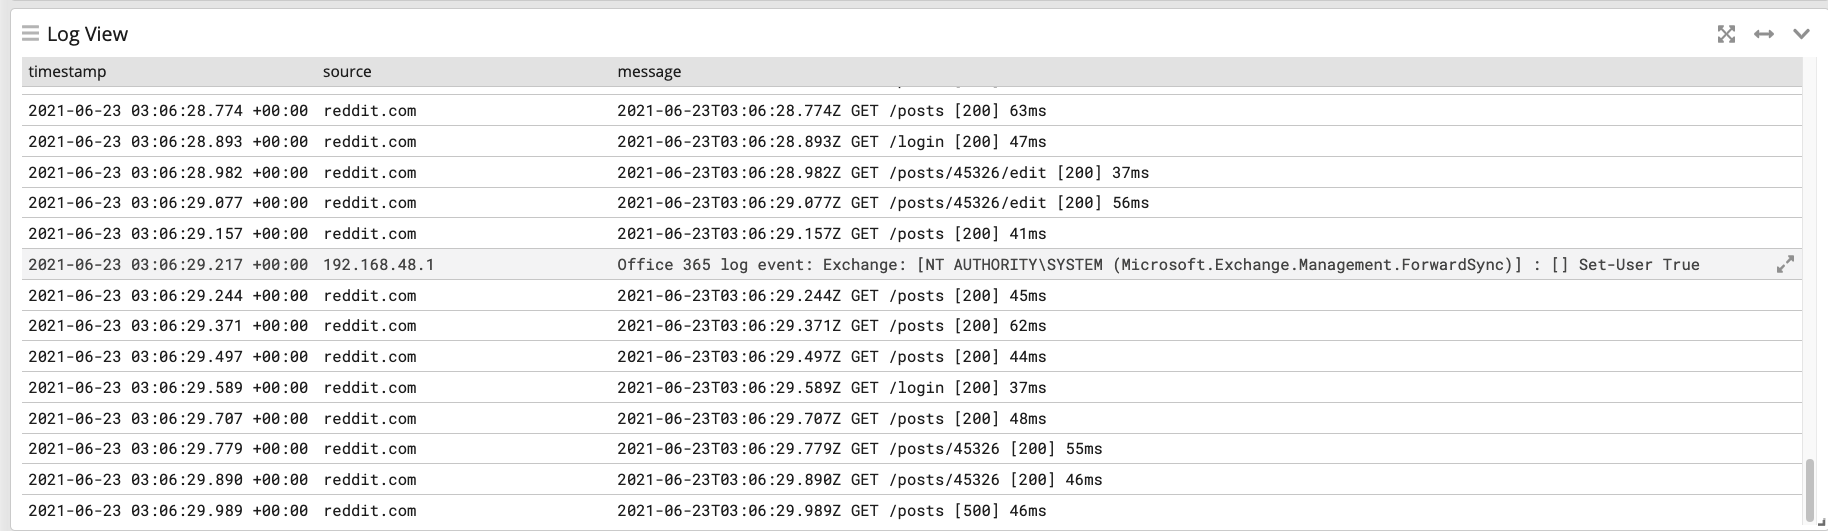
Focus on the Widget
When you return to the main Log View UI, identify the x-crossed arrow icon next to the other widget icons.
![]()
Click the icon to expand your widget to full view:
Build a Dashboard with Shareable Data
In this section, you will determine a format that best suits your message delivery efforts, and download a report.For example, you might pass on:
- plain text data to your peers for analysis (i.e. Log File/Plain Text )
- data to a logging library built in JavaScript (i.e. JSON )
- structured data objects to TCP or UNIX pipes (i.e. NDJSON )
If still configured, you may use the dashboard created in Create a Log View Widget .
![]()
Follow the steps
Click the chevron icon to access the Actions menu. (The icon is circled red in the image above.)
Choose Export from the menu to access the dialog.
- Output Format — choose from JSON, Log File/Plain Text, NDJSON (Newline-delimited JSON), or CSV.
- Fields to export — add additional fields to the pre-defined options chosen in Add New Fields to the Report .
- Time Range — Click the clock icon to configure an Absolute date range. The format is displayed in yyyy-MMM-dd HH:mm:ss.SSS.
Click the Start Download button after choosing all necessary fields and optional Messages limit .